A University Police officer blocks off the road during an incident at the Chemical and Biomolecular Engineering and Chemistry building. Credit: Michael Huson | Managing Editor for Content
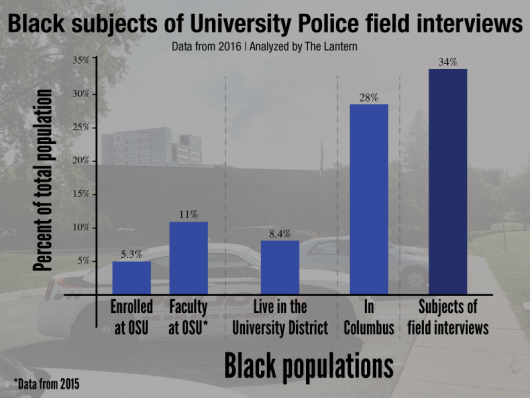
One out of 20 Ohio State students is black. One out of every 12 residents of the University District is black. Yet when University Police were responding to suspicious activity in 2016, one out of every three of the subjects of those field interviews was black.
Black subjects, when compared to Columbus’ and Ohio State’s overall population, made up a disproportionate number of field interviews conducted by University Police in 2016, according to a Lantern analysis of the 933 field interviews made last year. Of the 1,684 traffic stops conducted by University Police, black subjects were overrepresented as subjects of traffic stops when compared with the demographics of OSU’s student and employee population, as well as the population of the surrounding neighborhoods — though not compared to city-wide demographics.
The findings come on the heels of a new statewide policing standard that will require all police departments to collect race and gender data for anyone pulled over in traffic stops or questioned in field interviews. University Police had already been collecting the data since 2013.
Of the 933 field interviews, 34 percent involved black subjects. In 2015, 33 percent of field interviews involved black subjects.
In the report where the 2016 data was collected, University Police offered multiple explanations for the racial disparities, including accounting for Columbus’ black population, which makes up 28 percent of the city’s residents. Administration and Planning spokesman Dan Hedman highlighted the report’s findings in his responses to The Lantern as well.
At OSU, black drivers were involved in 15 percent of all traffic stops. OSU’s black student population is 5.3 percent of the student body, while the black population in the University District, comprised of the campus and surrounding neighborhoods, is 8.4 percent of the total population.
Of the 933 field interviews, 34 percent involved black subjects. In 2015, 33 percent of field interviews involved black subjects.
While a traffic stop requires a probable cause for police to engage, a field interview has different criteria. In a statement, Hedman said a field interview “could result from a community member calling for service or a suspicious person report,” in addition to an officer observing “suspicious behavior and (deciding) that a field interview is needed to assess the situation in an effort to enhance safety.”
The number of field interviews and traffic stops involving black subjects was addressed at length in the administrative review itself — obtained by The Lantern in a public records request — as multiple paragraphs are dedicated to explaining the reasoning for such discrepancies.
“We work hard to build and maintain the trust of our students and the entire university community,” Hedman said. “As a university agency, servicing a college campus, which is home to nearly 100,000 students, faculty, staff and visitors, we have a uniquely tailored approach focusing on both safety and education.”
The statement from Hedman also acknowledged that the department is required “to train (its) personnel in bias-based profiling issues and take corrective measures if it is determined bias-based profiling occurs.”
No corrective measures were taken and there were no reported citizen concerns of bias in 2015 or 2016, according to the report.
The review’s theories
The review, written by Capt. David Rose, who heads the patrol bureau, attributes the higher rate of black subjects interacting with police mostly to the surrounding campus area and Columbus’ black population, which is 28 percent of the total population.
“Roads passing through campus represent a convenient passage between surrounding communities so non-affiliates are likely well-represented in the sample,” Rose wrote in the review, referring to those not affiliated with the university as employees or students.
While the 2016 review did not record the OSU-affiliation of those pulled over or who were the subject of a field interview, the 2015 administrative review did. It found that 82 percent of field interviews involved nonstudents and nonemployees.

Credit: Robert Scarpinito | Managing Editor for Design
Affiliation was not recorded for traffic stops in 2015. The 2016 review states that “university affiliation is not reliably recorded during traffic citations so these data are missing to make a reliable interpretation.”
Since that data is no longer reliably kept, it is impossible to see the percentage of field interviews that are with students and employees.
“In addition to enhancing safety for our students, faculty and staff, we are a public institution and an open campus that welcomes more than three million visitors each year,” Hedman said. “As such, we have no plans to change the reporting.”
The surrounding area
Rose’s reasoning for the racial discrepancies is that the university area is open for nonaffiliated people to pass through, which accounts for the 6-percent gap between Columbus’ 28 percent black population and the percentage of field interviews carried out on black men and women, 34 percent. The proportion of traffic stops in which the subject was black — 15 percent — is lower than the 28 percent total city’s black population.
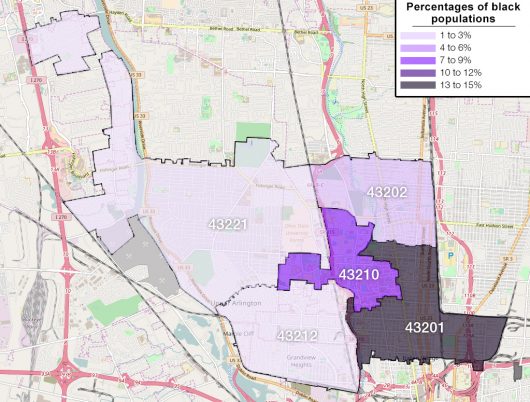
However, Census data from 2010 shows that the ZIP codes bordering the University District have a smaller black population than Columbus as a whole, although the most recent census data available is older and subject to unreported changes between 2010 and 2016.

Credit: Robert Scarpinito | Managing Editor for Design
The University District, the area that University Police patrols with some overlapping jurisdiction with the Columbus Division Police, is made up primarily of two ZIP codes, 43210 and 43201. This can be separated as on-campus and off-campus living areas, respectively.
OSU’s campus has its own ZIP code, 43210, which is 7 percent black, according to census data. The surrounding ZIP code, 43201 — which stretches several blocks north of Lane Avenue down to the Short North and from roughly State Route 315 to Interstate 71 — is 14 percent black. Together they make up the University District, the most densely populated area in Columbus.
As defined by city code, the University District’s boundaries are Fifth Avenue to the south, Glen Echo Ravine to the north, train tracks to the east and the Olentangy River to the west.
The neighboring ZIP code to the north, 43202 — which includes Riverview, the northern portion of the University District — is 4 percent black. To the west, 43212 — which includes Hillside and a large segment of Upper Arlington — is 3 percent black and ZIP code 43221 — which largely includes the northwest portion of campus — is 2 percent black, and shares a significant border with OSU’s ZIP code as well.
University employees, international students
The 2016 review also says the number of black university employees could affect the racial ratio in University Police’s traffic stop data. However, according to a diversity report from 2015 done by OSU’s Office of Human Resources, black employees make up 11 percent of the total employees at OSU.
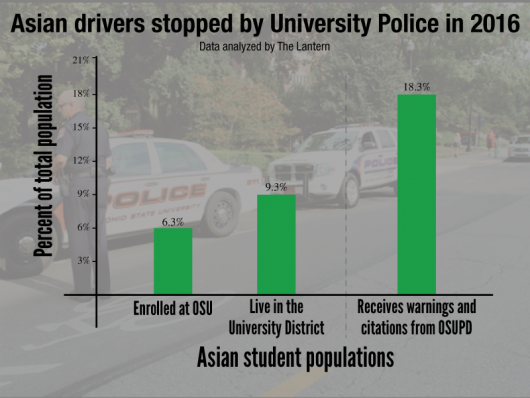
Additionally, the review shows that Asian drivers are getting pulled over at a disproportionate rate, and the report offers explanations for why that could be as well.

Credit: Robert Scarpinito | Managing Editor for Design
The OSU Asian student population is about 6 percent of the total student body, and the Asian population of the University District is 9 percent of the total. However, Asian drivers make up 18 percent of total warnings or citations by University Police.
“Many international students attending the university not only lack driving experience but obtain driving privileges for the first time upon arriving at the university,” Rose wrote. “A proximate cause of this over-representation of Asian drivers may be a result of driver inexperience.”
As Ohio’s police departments begin to record race and gender during stops, Ronnie Dunn, an associate professor of urban affairs at Cleveland State University who helped craft the new policing standard, said the hope is that transparency and accountability is brought across the board.
“This helps us better understand exactly who the police are having interactions with,” Dunn said.


